Basics of the Bode plot
A Bode plot is a graphical toolbox for displaying the frequency characteristics of a system. It consists of two plots, the gain response and the phase response.
- Gain response: Indicates the gain of the system (ratio of the output gain to the input gain) as a function of the frequency.
The gain is specified in decibels [dB]. - Phase response: Indicates the phase shift of the system (relative delay from input to output) as a function of frequency.
The phase shift is specified in degrees [°].
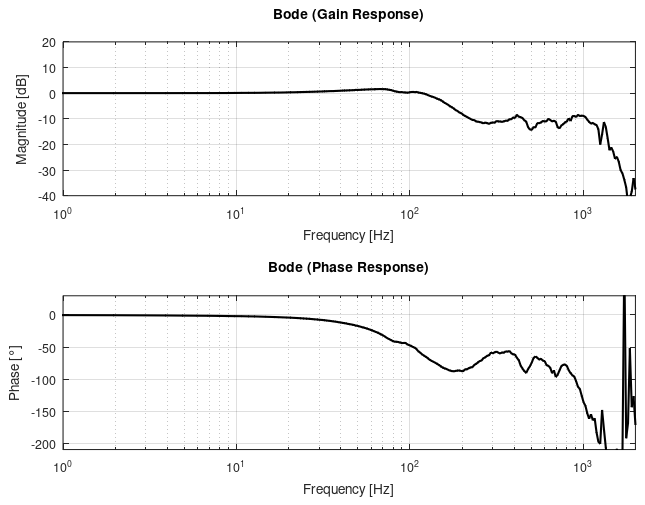
The specific properties of a mechanical drive system can be graphically displayed
and determined using the Bode plot. It also provides information about the system stability and the dynamics of the system.
In the following, the Bode plot for mechanical control systems is explained in such a way that the meaning of the variables and parameters used in the user interface with regard to dynamics and stability is made clear and a basic understanding of how to read a Bode plot is taught.
To describe the system characteristics using the Bode plot, it is necessary to divide the control drive system into open and closed control loops.
 | In a control system with a cascade structure, consisting of a current, speed and position control loop from inside to outside, the speed control loop is the one in which the mechanical system properties act. |
- Open loop (OL for short)
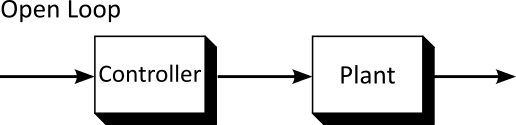
Control loop without feedback consisting of controller, controlled system (mechanical system in this case) and feedback (sensors).
- Closed loop (CL for short)
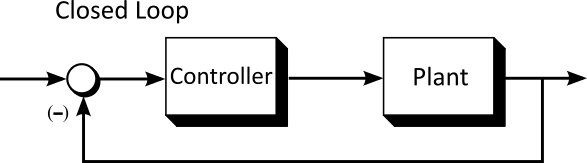
Control loop with feedback - Consideration of the frequency-dependent gain and phase shift of the real drive control.
- Consideration of the dynamic properties of the control system.
Open loop (stability analysis)
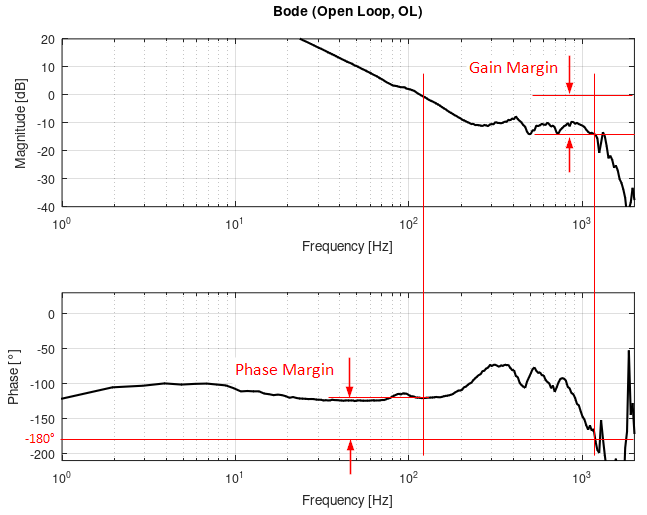
System stability is determined on the basis of the phase margin and the gain margin.
- Phase margin (phase response, Stability conditions)
Distance of the phase in the phase response of 180°, at the point at which the gain response falls below 0 dB when viewed from the left.
In practice, the phase margin should be at least 30° - 40°. - Gain margin (gain response, Stability conditions)
Distance of the gain in the gain response from 0 dB, at the point at which the phase gain falls below 180° when viewed from the left.
In practice, the gain margin should be at least 6 - 8 dB.
Closed loop
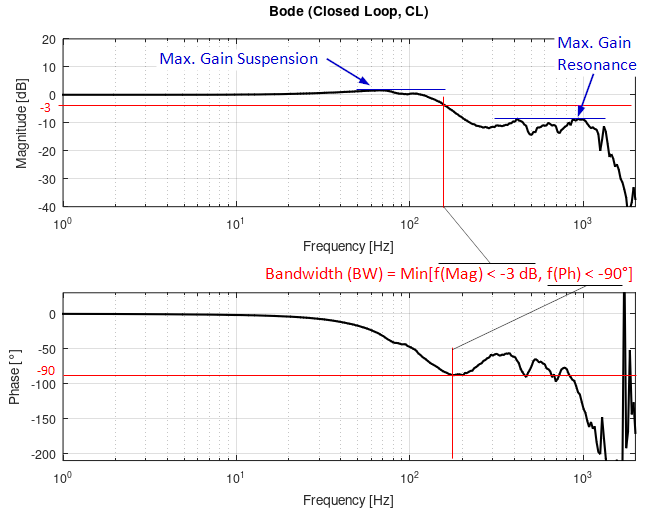
The Bode plot of the closed loop shows the physical effect of the frequency-dependent gains and phase shifts.
The ideal system would be one for which the output signal has the same gain as the input signal for all frequencies and has no delay in relation to the input signal. Such a system has zero values for gain and phase in the Bode plot.
In practice, this is not possible in a real system for energy and runtime reasons. As the frequency increases, the output signal becomes weaker than the input signal over time and exhibits an increasing phase shift compared to the input signal.
Furthermore, resonance points and the parameterization of the controller can cause the gain of the output signal to exceed that of the input signal locally for certain frequencies. In this context, the terms bandwidth and maximum gain are defined.
- Bandwidth (Stability conditions)
Minimum of the two frequencies at which the gain response falls below -3 dB as seen from the left and the phase response falls below -90° as seen from the left. - Max. gain (Stability conditions)
Maximum permissible gain in dB.
In practice, this can be selected between 1 dB (Soft: factor 1.122) and 3 dB (Stiff: factor 1.413) depending on the application.
Optimization goals
In principle, short machine throughput times are required for high productivity.
These require correspondingly high bandwidths of the drive controllers used for fast processing while guaranteeing the requirements for accuracy and precision.
The demands for a high bandwidth and high stability are usually contradictory. An increase in bandwidth generally leads to lower stability and vice versa. Another optimization goal can be requirements for the smooth running of the drive. Moderate controller gains are often advantageous for smooth running.